

Three grids can describe the same Bitcoin price differently. A monthly map may call a recovery bullish, a quarterly map may place it near an upper destination, and the annual map may still locate it below the lower inner band. Those descriptions can all be correct at the same time.
The challenge is not to make every grid agree. It is to understand what each grid measures, where their references overlap and when a lower-period move is approaching an area that matters on a larger map.
In Multi Timeframe Analysis With Pivot Points (Bitcoin 2026), I use monthly, weekly and daily charts to connect annual, quarterly and monthly pivot grids. This guide expands that routine with the calculations, the recorded Bitcoin sequences and a practical method for documenting confluence without mistaking correlated levels for independent evidence.
All 2026 price references below belong to the supplied October 2026 recording. They are rounded historical examples. The page does not update those scenarios from a live data feed, and the examples should not be read as current market instructions.
Multi Timeframe Analysis With Pivot Points (Bitcoin 2026)
What multi-timeframe pivot analysis means
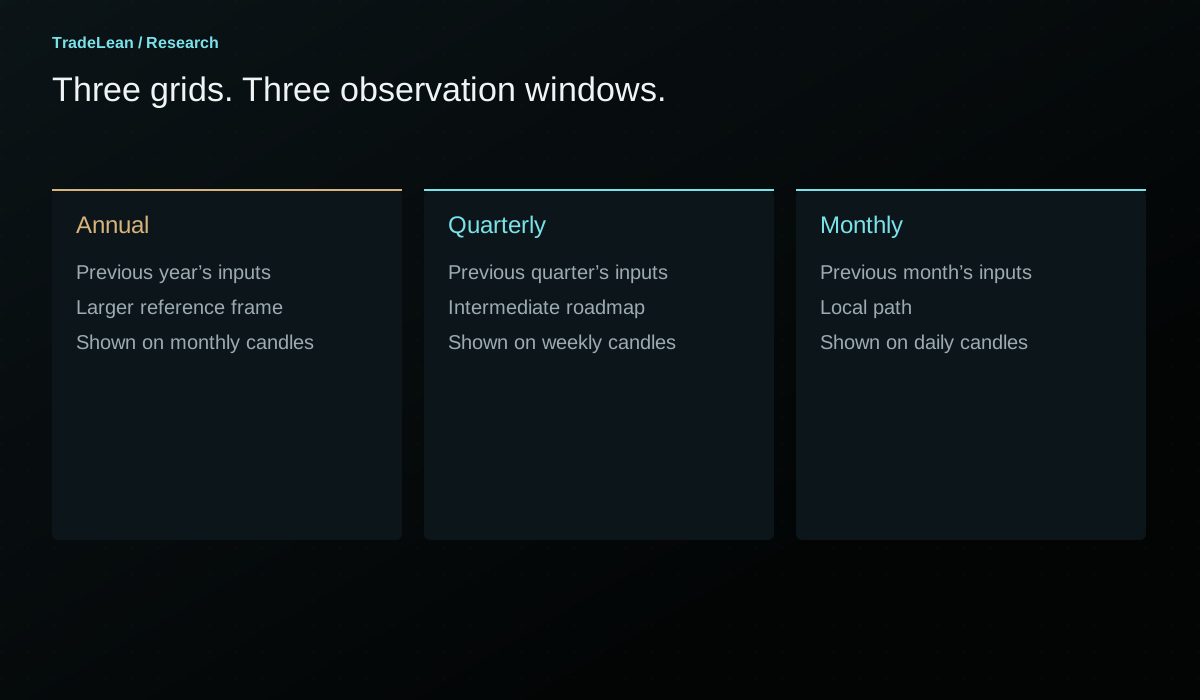
Multi-timeframe pivot analysis compares reference grids calculated from different completed periods. An annual grid uses the previous year's high, low and close. A quarterly grid uses the previous completed quarter. A monthly grid uses the previous completed month. Each grid has its own pivot and its own high-to-low range.
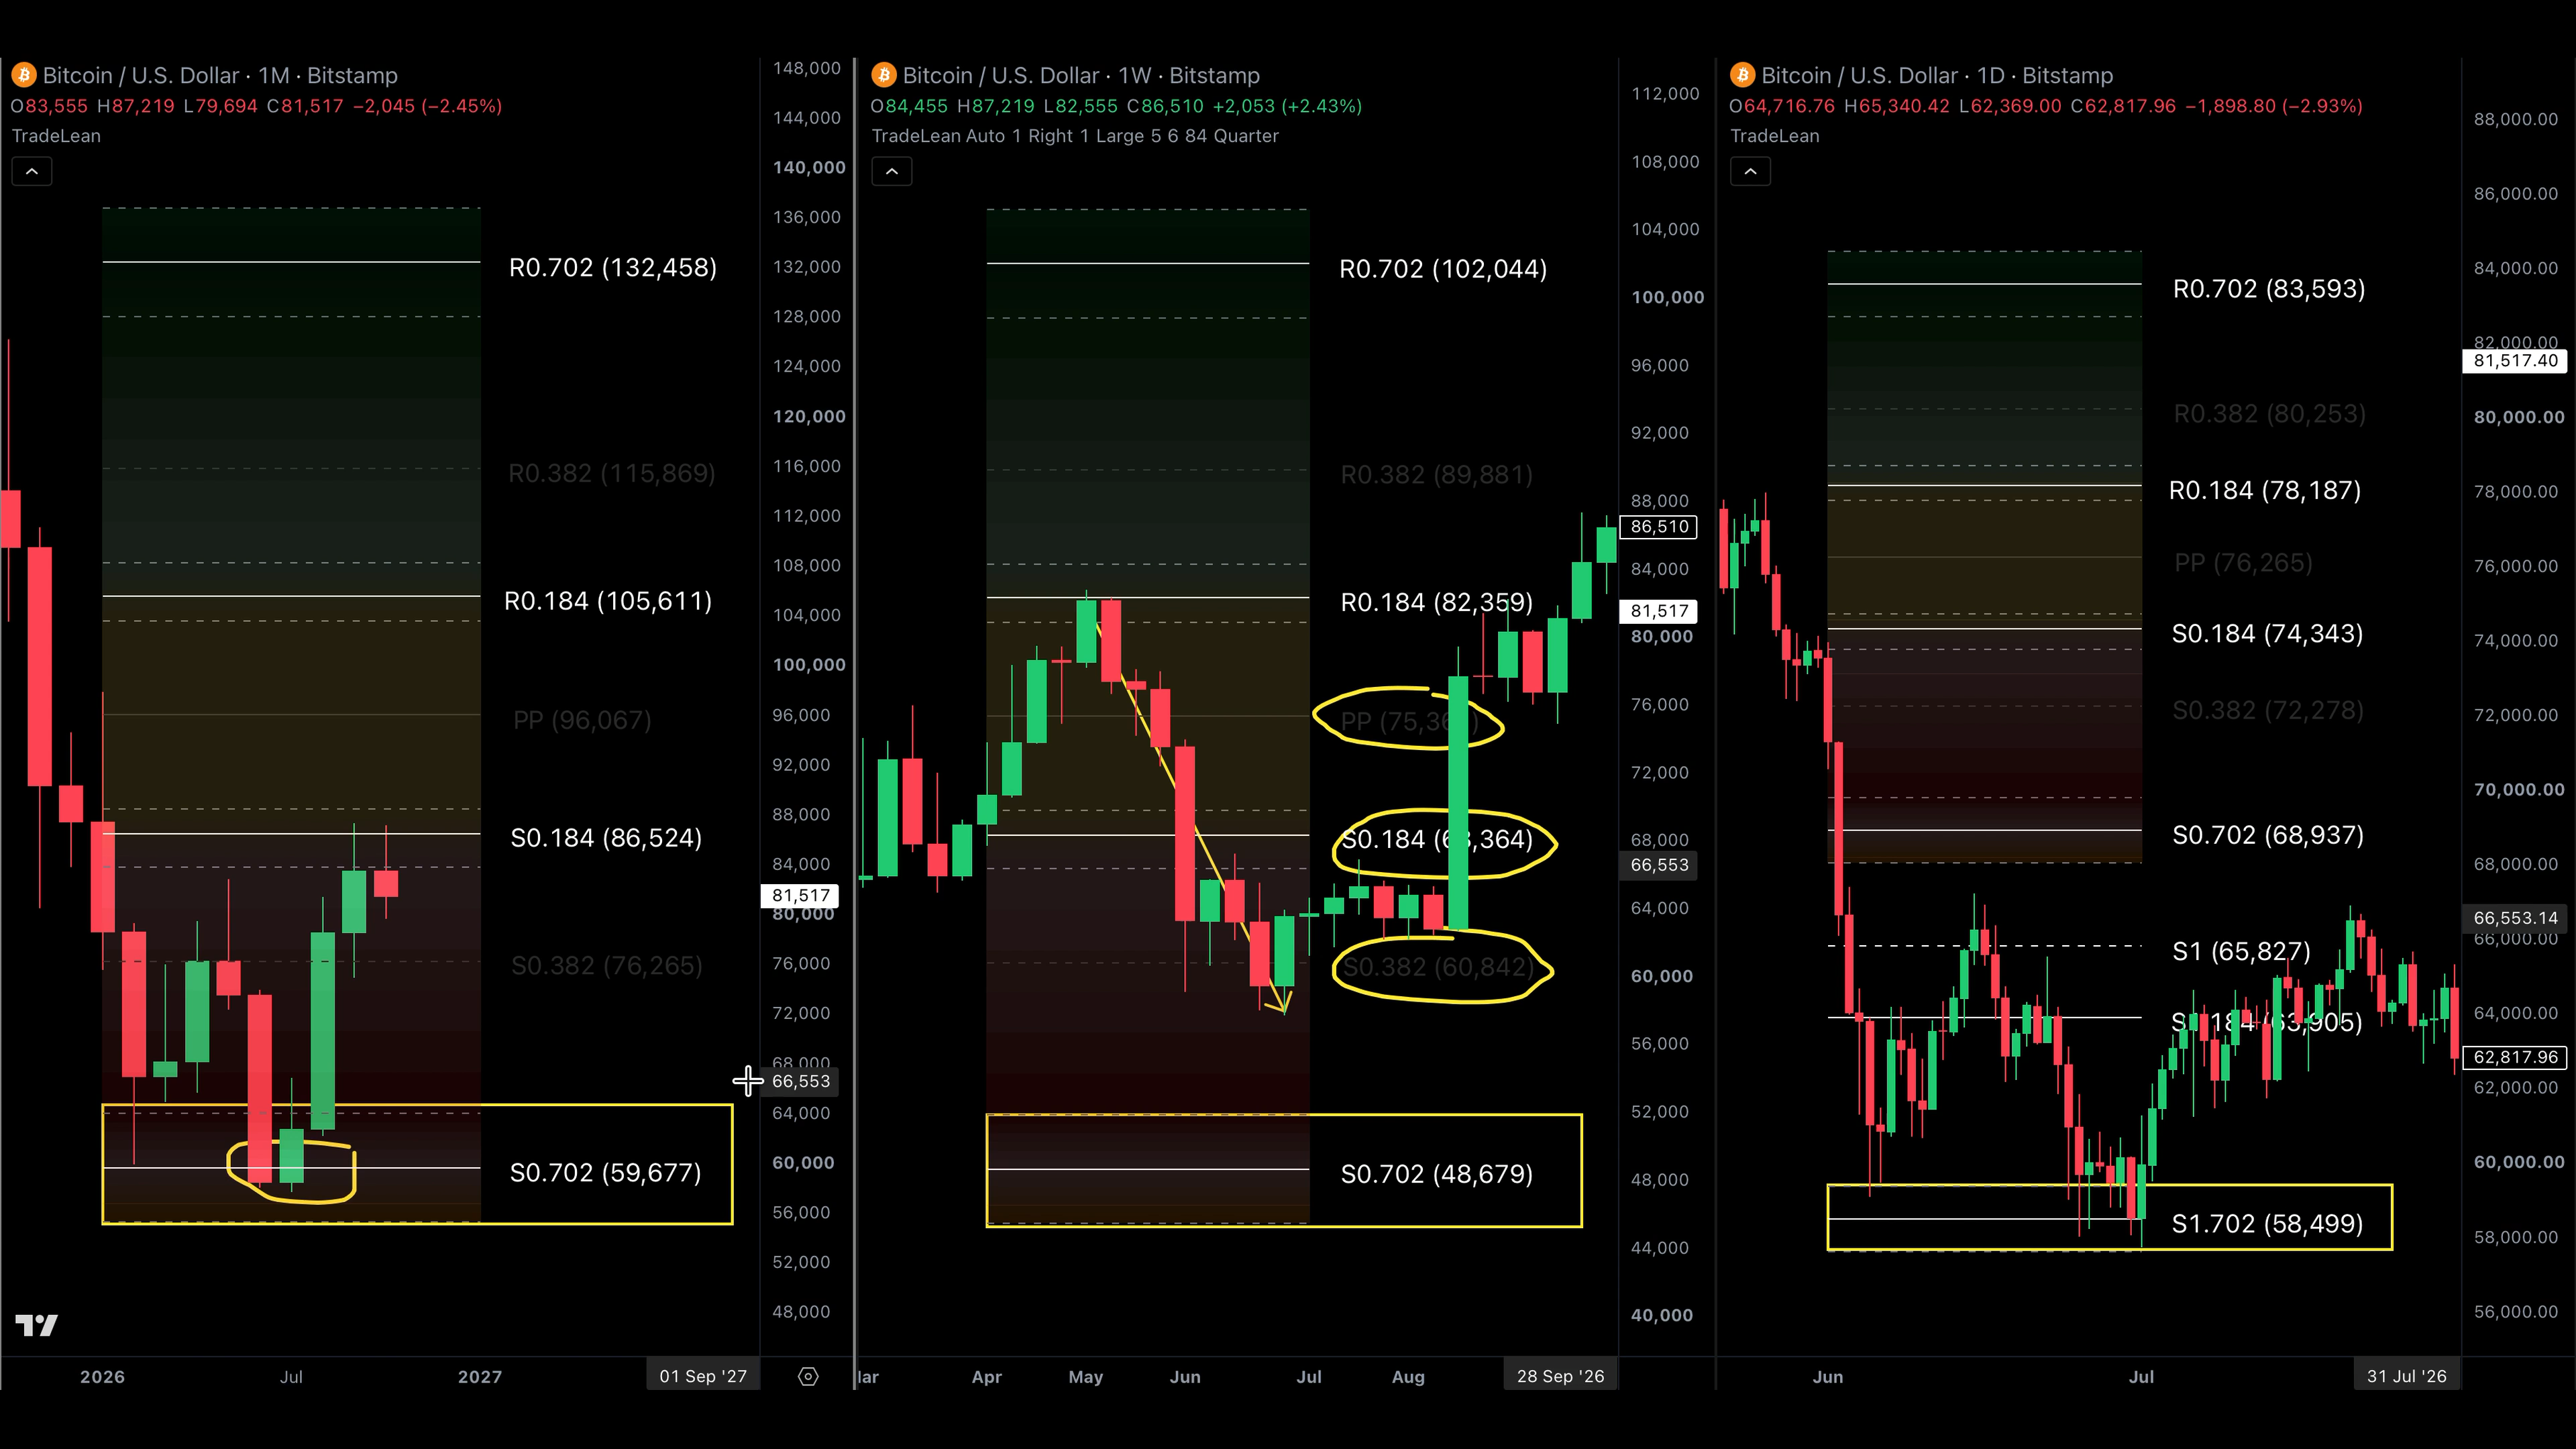
The grids can be displayed on different candle resolutions without changing that underlying definition. In the recording, the monthly chart carries the annual grid, the weekly chart carries the quarterly grid and the daily chart carries the monthly grid. The chart timeframe determines the duration of each candle; the pivot timeframe determines the observations used in the calculation.
That separation prevents a common misunderstanding. A weekly candle does not automatically mean weekly pivots. A daily chart can display an annual grid if the indicator is configured to use one. The relationship shown in the TradeLean routine is a chosen presentation, not a universal property of every charting platform.
At each level, the arithmetic remains P = (H + L + C) / 3 and D = H - L. The ratios then place references above and below that grid's own P. There is no single universal pivot that every timeframe shares.
| Chart used in the routine | Pivot grid | Completed inputs | Typical reset |
|---|---|---|---|
| Monthly candles | Annual | Previous year's H, L and C | Start of the next defined year |
| Weekly candles | Quarterly | Previous quarter's H, L and C | Start of each new quarter |
| Daily candles | Monthly | Previous month's H, L and C | Start of each new month |
| Four-hour candles | Weekly | Previous week's H, L and C | Start of the next defined trading week |
Calculation reference: TradingView: Pivot Points Standard
The larger map provides context, not certainty
In the walkthrough, I describe the higher timeframe as the direction and destination, with the lower timeframe showing the path and timing. It is a useful organising principle. It should not be interpreted as a guarantee that a larger-period reference always defeats a smaller-period move.
The annual grid places the current market relative to a full completed year's observations. The monthly grid places it relative to a much shorter window. The annual context helps identify whether a local advance is approaching a substantial annual reference, even if the monthly path still looks constructive.
The lower grid can contribute useful detail. It shows intermediate references that are invisible on a chart with only annual levels. It can help describe a retest, a failed recovery or a rapid move through a short-period map. Its value is in adding resolution to the question already defined by the larger context.
A hierarchy is most useful when it controls attention. Start with the annual location, add the quarterly map, and use the monthly grid only where it clarifies the path. If every grid is allowed to generate a separate narrative, the result can be four explanations and no decision about which observation matters.
Build the same instrument three times
A comparison begins with consistent data. Use the same instrument, exchange, quote currency and session convention across the charts unless the purpose is explicitly to compare feeds. BTC/USD on Bitstamp and BTC/USDT on Binance are different series. Their levels can be close without being interchangeable.
The recording contains particular chart examples and rounded narration. When reproducing the method on your own charts, the first goal is internal consistency. Do not switch feeds merely to force an annual pivot or a monthly boundary to match the last rounded dollar in a spoken example.
Next, label the grids visibly. A price near 83,000 is not enough information when one line is a quarterly R 0.184 and another is an annual S 0.184 boundary. The grid name and period are part of the reference.
Finally, synchronise the observation date. If the annual chart is shown at the end of January while the monthly chart has already advanced into February, the short-period grid may have reset. Without a clear date, the comparison can unintentionally mix observations that were never available together.
Confluence is an overlap, not an exact coincidence
Confluence describes references from different grids occupying the same price area. It may involve two focal lines, a focal line within another grid's band or two bands whose intervals overlap. These are related but different geometries.
An exact equality is uncommon and unnecessary. A quarterly pivot at 98,100 and an annual pivot near 96,000 are not identical prices. Whether they form one useful area depends on their separation, the widths of the relevant bands and the context of the instrument. Calling every pair of nearby-looking lines confluence makes the term uninformative.
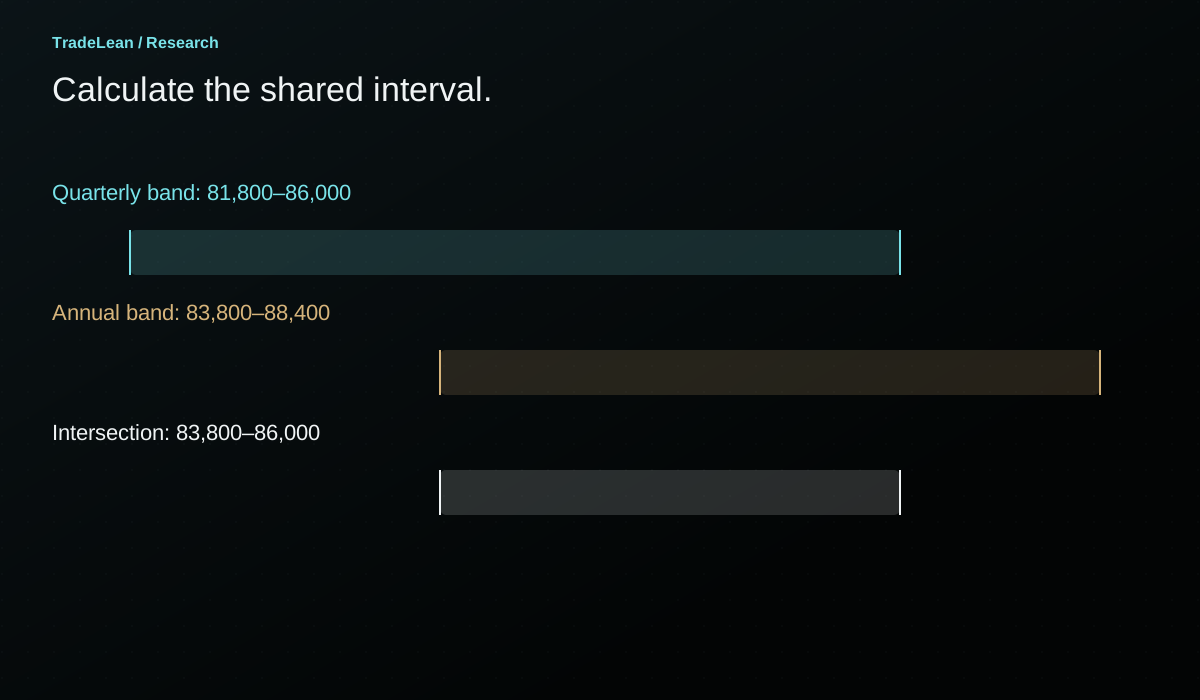
A clean method writes the intervals explicitly. If one band spans 81,800-86,000 and another begins around 83,800, the overlap starts at the larger lower bound and ends at the smaller upper bound. That interval can be calculated instead of estimated by eye.
The distance between focal references can also be recorded in price units or relative to a declared range measure. The important point is to choose the tolerance before selecting examples. A rule that calls 500 dollars close in one chart and 5,000 dollars close in another needs an explanation beyond the eventual outcome.
Similar grids are not independent votes
Annual and quarterly grids can share much of their underlying information. If the final quarter contains the year's high and much of its range, the annual and first-quarter calculations can produce similar references. That is a mathematical relationship between overlapping observation windows.
Three aligned grids should therefore not be described as three independent confirmations. Their agreement may be useful for organising the chart, but the inputs are correlated. The same high, low or closing region can influence more than one map.
The January example in the recording makes this visible. The quarterly grid resembles the annual grid because the previous quarter contains much of the prior year's important range. The resemblance is part of the explanation, rather than an additional mysterious signal.
A more defensible research question is whether an explicitly defined overlap changes the subsequent distribution of outcomes compared with otherwise similar encounters at a single grid. That requires a sample and a comparison rule. Counting the number of coloured lines around a historical turn does not answer it.
January: three references near the same destination
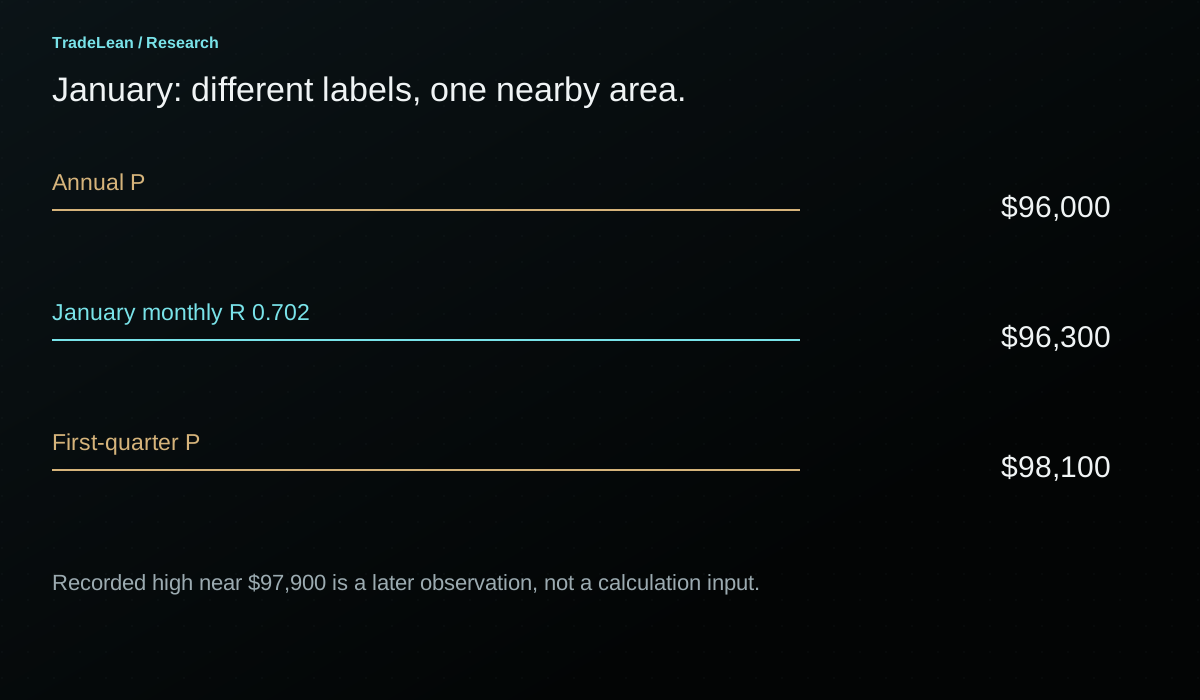
The recorded January configuration includes an annual pivot near $96,000, a first-quarter pivot near $98,100 and the January monthly R 0.702 near $96,300. These references occupy a relatively compact area compared with the larger annual map.
On the monthly pivot grid, the early advance moves beyond the upper inner area and revisits it before continuing towards the outer reference. On the annual and quarterly maps, that same advance approaches central pivots rather than an upper outer destination.
This is the first important distinction: the same physical price can be an outer reference on one grid and a central reference on another. A label such as monthly R 0.702 does not carry an absolute meaning independent of the period that produced it.
The recording describes a January 14 high around $97,900 within the broader cluster. Subsequent weakness returns through the monthly map. That sequence illustrates the usefulness of identifying the destination area before examining the reaction, but it does not establish that the reaction's exact date, size or duration was predictable from the overlap alone.
A precise historical note would list all three references, state the date on which they were available and record the later encounter separately. This keeps the map's availability distinct from the later knowledge that the cluster coincided with a high.
| Recorded January reference | Approximate value | Meaning on its own grid |
|---|---|---|
| Annual P | $96,000 | Centre of the annual roadmap |
| January monthly R 0.702 | $96,300 | Focal upper outer reference on the monthly roadmap |
| First-quarter P | $98,100 | Centre of the quarterly roadmap |
| Recorded January high | $97,900 | Later price observation, not an input to those already calculated references |
February: a cluster does not prevent an overshoot
The February monthly map is rebuilt from January's completed range. Its lower 0.702 reference is discussed near $68,300. The quarterly lower reference is around $66,000, while the annual lower outer area begins near $64,000 in the rounded narration.
The recording then describes a February 6 decline through these areas to around $59,900, followed by a recovery on the same day. This is an important counterweight to the tidy January example. A cluster identifies an area to observe; it does not prevent price from travelling through several references before reacting.
The subsequent closing behaviour provides more information than the lowest print alone. The recorded day finishes back above the monthly lower outer area, and the rest of the month includes consolidation around those lower references. The month ends near $67,000 in the narrated example.
At this point, the grids are connected through the same physical price region, but the closing classifications differ by candle period. A daily recovery and a monthly closing location are not interchangeable observations. State which one supports each part of the interpretation.
If a research hypothesis concerns a monthly close inside overlapping outer bands, the intraday low is contextual information rather than the event that defines eligibility. If the hypothesis concerns an intraday rejection, a monthly chart alone cannot describe the sequence of fills or the speed of the recovery.
March: a new monthly map inside an unchanged quarter
At the start of March, the monthly grid resets again. The annual and first-quarter maps remain tied to their existing reference periods. This creates a useful comparison: one layer changes while two others remain fixed.
In the recording, March spends its time around the central part of the new monthly map. The narrated R 0.702 near $82,400 becomes relevant later because a similar price appears in the next quarterly grid and a subsequent monthly band.
That later similarity needs careful language. The March reference existed during March. The second-quarter reference became available only after the first quarter closed. A May monthly band depended on April's completed inputs. These observations can be compared historically, but they were not all available on January 1.
The timing of availability is especially important in a long article with several diagrams. A reader can see all the panels on one page and unconsciously treat them as one simultaneous map. Date labels and period labels prevent that mistake.
The second quarter: the same area appears again
The second-quarter upper inner reference is described near $82,400, close to March's upper outer reference. The May monthly upper outer band also begins near that area in the recording. Price later tests around $82,800 and fails to retain the advance.
This is an example of a recurring price area across successive grids, rather than three permanent levels plotted for an entire year. Each reference has a different calculation window and a different availability date. A proper reconstruction should preserve those dates even when the overlap looks visually compelling.
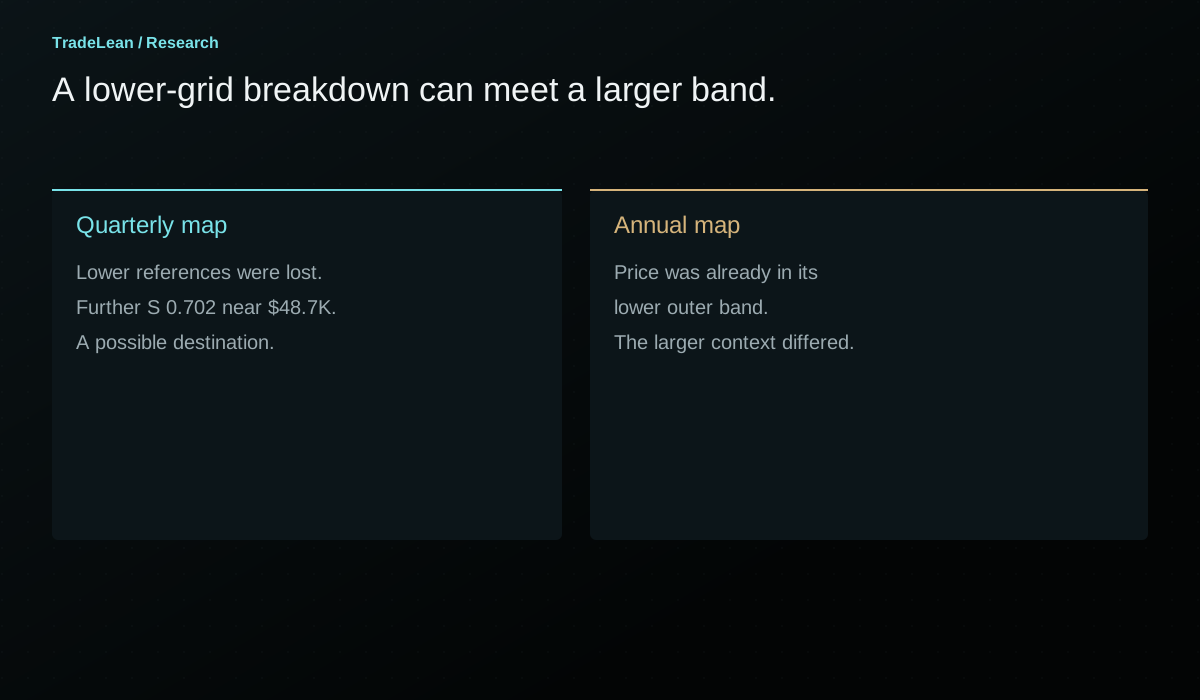
The subsequent June decline travels through the monthly lower outer area and beneath an additional monthly reference. The quarterly chart also looks weak relative to its own pivot and inner support area. If those lower and intermediate grids were viewed alone, attention could move towards the next quarterly lower destination.
The annual map provides the missing context. Price is already entering the annual lower outer band. The question becomes whether a lower-grid breakdown is taking place into a larger-period reference area, rather than into empty chart space.
June and July: disagreement can be informative
The recording places the second-quarter S 0.702 near $48,700, while the annual lower outer band contains the much higher area where price is already trading. The June close is discussed around $58,500, and the following low occurs near the beginning of July in the historical sequence.
This is the clearest illustration of the hierarchy in the walkthrough. A lower-period grid can point towards a destination that the larger map does not require. The existence of a quarterly level near $48,700 is not evidence that the market must visit it before the quarterly interpretation can change.
My practical preference in this situation is to avoid treating the lower-grid breakdown as sufficient information on its own. The annual outer zone is part of the context. That is a rule for how I organise attention, not a guarantee that the annual band will hold.
The opposite outcome must remain possible. An annual outer zone can also break. If the analysis is framed so that every lower-period failure is ignored indefinitely because a higher band exists, the hierarchy has become a way to resist contrary evidence rather than a way to interpret it.
A complete note should therefore state both the conflict and the observation that would weaken the larger-period interpretation. It should say what price is doing at the annual band, which close matters and how the lower maps will be reassessed after their next reset.
The third quarter: a local advance towards a larger reference
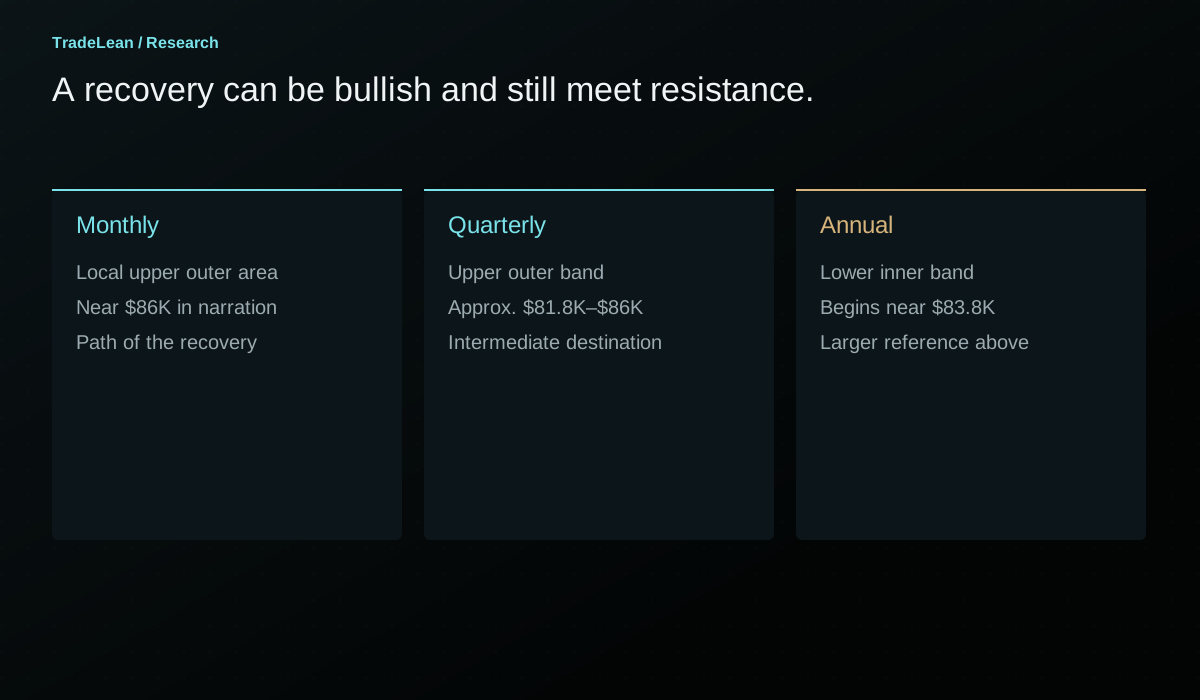
The third-quarter grid in the recording has P near $66,500, R 0.184 near $71,000 and an upper outer band around $81,800-$86,000. Early trading remains around the quarterly centre and lower inner area before a strong August advance moves beyond the upper inner reference.
On the monthly map, the same advance travels rapidly through several references. This is a reminder that a lower grid can be crossed quickly during a strong move. A nearby monthly level is not necessarily a durable obstacle simply because it has a precise label.
The later September advance reaches the quarterly upper outer area. The annual lower inner band begins around $83,800 in the rounded reconstruction, and the September monthly upper outer area begins around $86,000. Those intervals place several different grid meanings near the same physical region.
Price can therefore be bullish on the quarterly and monthly maps while still approaching an annual reference from below. There is no logical contradiction. The shorter maps describe the recovery; the annual map identifies a larger reference encountered by that recovery.
The recorded September high near $87,400 is a later observation against that cluster. A review should preserve both the approach and the extent of any excursion beyond the stated boundaries, rather than drawing a single narrow rectangle that makes every reference look exact.
The fourth-quarter map is a dated scenario
The recording's fourth-quarter configuration places the quarterly pivot near $78,400 and its upper inner reference near $83,200. It describes Bitcoin near the centre of the October monthly map and below the annual lower inner band.
The overlap above price is the relevant nearby area in that historical snapshot. The quarterly upper inner band and the annual lower inner area occupy part of the same region. A local rally into that area has to be interpreted against both maps, rather than described only as a monthly recovery.
Further away, the recording places quarterly R 0.702 near $96,700, close to the annual pivot near $96,000. On the lower side, the quarterly S 0.702 around $60,000 is close to annual S 0.702 near $59,700. Those alignments define possible destinations conditional on leaving the intervening areas.
The essential word is conditional. The presence of upper and lower destinations does not decide which one occurs, whether either is reached during the quarter or how long price might remain near the centre. A dated scenario is useful when its branching conditions are visible and its later outcome can be reviewed honestly.
This page preserves that recorded setup as an example. It does not present the October snapshot as a live forecast for the reader's current date.
A confluence matrix that stays readable
Instead of drawing every line from every grid, create a small matrix. Give each grid one row and record its pivot, nearest inner band and nearest outer band. Add a separate column for current location at the observation date.
The matrix exposes differences that a crowded chart can hide. One row may say price is below the annual inner band. Another may say price is between the quarterly pivot and upper inner reference. A third may place it near the monthly pivot. The comparison becomes explicit without forcing all three rows into one adjective.
Then identify only the overlaps relevant to the current question. If the market is near the quarterly centre, a distant overlap may be a possible destination rather than an immediate decision area. Distinguish those roles so the chart does not imply that every highlighted rectangle matters equally today.
| Grid | Current location to record | Nearby reference | Further destination |
|---|---|---|---|
| Annual | Neutral, above upper inner band or below lower inner band | Closest annual boundary | Annual outer zone or central pivot, depending on the path |
| Quarterly | Position relative to quarterly P and inner bands | Next quarterly transition area | Quarterly outer band |
| Monthly | Local position and most recent completed close | Immediate monthly band or pivot | Next monthly reference before a reset |
| Overlap note | Which intervals intersect | Exact shared interval | Conditions required before a distant overlap becomes relevant |
How to calculate an overlap without drawing it by eye
Suppose the first band is 81,800-86,000 and the second is 83,800-88,400. The common interval is 83,800-86,000. Its lower bound is the maximum of the two lower bounds; its upper bound is the minimum of the two upper bounds.
Now suppose a third band begins at 86,100. It does not strictly overlap the shared interval because its lower bound is above 86,000. It may still be nearby under a declared tolerance, but proximity and overlap should not be labelled as the same thing.
A focal line inside a band is another case. If a pivot at 84,500 falls within the interval 83,800-86,000, the line lies inside the overlap. It does not make the overlap wider. Keeping those geometries separate makes the resulting diagram easier to audit.
For a more formal comparison, record the overlap width and the widths of its component bands. A tiny intersection near two edges may deserve different attention from a broad shared area. That distinction is mathematical; whether it predicts different subsequent behaviour remains a research question.
The reset calendar belongs in the analysis
Annual, quarterly, monthly and weekly grids do not all reset on the same dates. A quarterly map persists while several monthly maps change. Around the turn of a quarter, the annual map may remain fixed while both the quarterly and monthly maps reset together.
This matters for a scenario recorded near a boundary. A destination on the old monthly map can disappear or move when the new monthly inputs become available. The annual reference may remain exactly where it was. If a review continues to measure against an expired short-period grid, it should say so explicitly.
A sensible routine saves a screenshot and the underlying input values before a reset. After the reset, create a fresh note rather than overwriting the previous grid's history. The record should make it possible to reconstruct what was visible on each date.
The distinction also helps explain why a chart can look dramatically different at the start of a new month without a corresponding overnight change in the market. The price may have barely moved while the mathematical reference frame changed substantially.
A three-pass chart routine
The first pass uses the annual grid. Record the current location and the nearest meaningful annual areas. Ask what larger reference the market is approaching, not merely whether the most recent candle is green or red.
The second pass adds the quarterly map. Record whether its location agrees with or differs from the annual classification. Mark a limited number of overlaps and write why each is relevant: current encounter, intermediate reference or distant conditional destination.
The third pass uses the monthly grid to follow the local path. Observe how price behaves near the areas already identified. A monthly line far from the larger context may be less important to the current question than a modest monthly reaction occurring within a larger overlap.
This routine is deliberately selective. More lines do not automatically mean more information. The purpose of the lower chart is to answer a narrower question, not to create enough possible references that some line will always appear to explain the latest candle.
What multi-timeframe analysis cannot establish
Confluence does not measure the actual order book or the intentions of market participants. The grid is calculated from prices, not from a census of resting orders. A reaction at an overlap may be interesting without proving a particular causal story about why it occurred.
It also does not convert correlated historical observations into independent probability estimates. A collection of annual, quarterly and monthly references can share inputs and still fail together. Their visual agreement is a reason to define a research question, not a reason to announce a numerical confidence level without a study.
Finally, the framework does not decide position size, execution method or acceptable loss. A well-described area can still produce a poor trade if the invalidation distance, liquidity or timing does not fit the separate decision process. The map and the implementation of a trade should be reviewed separately.
A worked review you can repeat
Choose one historical month and stop the chart before it begins. Calculate the annual, quarterly and monthly grids using only completed inputs available at that point. Record the period labels, feeds and any overlapping intervals.
Write three possible paths. One may involve an advance towards an upper cluster. Another may involve a decline towards a lower band. A third may involve continued central trading. For each, state the observation that would make it relevant and the observation that would weaken it.
Advance the chart one chosen candle at a time. Keep notes about actual encounters, closing positions and period resets. If the market moves through a level without reacting, record that too. The exercise should include the parts of the path that a completed-chart screenshot would normally omit.
At the end, compare your initial map with the observed path. Did the overlaps narrow your attention usefully? Did the lower chart clarify the sequence or encourage constant reinterpretation? Did a later grid accidentally enter your reasoning before it was available? These questions turn a visual technique into a disciplined review.
The fillable worksheet can hold the initial definition and the outcome. Use a separate copy for each reference setup, especially across quarterly resets.
A numerical example of why grids can disagree
Consider an annual reference period with H = 140, L = 60 and C = 100. Its pivot is 100 and its range is 80. The annual lower 0.184 focal reference is 85.28. Now consider a recent completed month with H = 84, L = 68 and C = 80. Its monthly pivot is approximately 77.33 and its range is 16.
A current price of 82 is below the annual lower inner focal reference but above the monthly upper 0.184 focal reference, which is approximately 80.28. The price has not changed between those two descriptions. The calculation window has changed.
This is the mathematical basis of a local recovery within a larger weak location. There is no need to decide that one of the charts is wrong. The question is which reference frame answers the analytical question currently being asked.
The monthly upper outer band in this hypothetical example begins around 87.22 and ends around 89.91. That region is near the annual lower inner area, whose boundaries run approximately from 81.12 to 88.32. The common interval is around 87.22-88.32. A bullish monthly move can therefore approach an area that still matters on the lower side of the annual grid.
All numbers in this example are hypothetical. Their purpose is to show how the same formulas create apparently conflicting labels and a calculable overlap without relying on the outcome of a selected historical market move.
| Hypothetical calculation | Annual grid | Monthly grid |
|---|---|---|
| H / L / C | 140 / 60 / 100 | 84 / 68 / 80 |
| P | 100.00 | 77.33 |
| D | 80.00 | 16.00 |
| Lower 0.184 focal reference | 85.28 | 74.39 |
| Upper 0.184 focal reference | 114.72 | 80.28 |
| Price being described | 82.00 | 82.00 |
| Location relative to focal inner references | Below the lower inner reference | Above the upper inner reference |
What belongs in a pre-period map
Before the next month begins, the completed annual and quarterly inputs are already fixed if their periods have closed. The next monthly grid becomes available when the current month finishes. A pre-period map should include only the layers whose inputs are complete at the stated timestamp.
For every layer, record its reference start and end dates. This sounds laborious until a historical example crosses a quarter boundary. The date record immediately explains why an older quarterly level was visible in one screenshot and absent in another.
A map should also identify which references remain active under the chosen convention. Some researchers retain old pivots as historical landmarks after the period resets. Others display only the current grid. Both approaches can be studied, but combining them without a rule produces an ever-growing collection of lines.
If old levels are retained, distinguish them visually and label their original periods. Otherwise, a current monthly band and a prior-quarter pivot can appear to be two simultaneously calculated references with equal status. The reader needs to know which is current context and which is historical carryover.
A conflict checklist before following the lower chart
When the monthly chart appears to signal a continuation, first locate the annual and quarterly areas immediately ahead. A lower-period move occurring in open space is different from one that has already arrived inside a larger outer band.
Next, check whether the apparent agreement depends on using focal lines in one grid and full boundaries in another. The annual S 0.184 line may be near a quarterly R 0.184 boundary without the two full bands overlapping in the way the screenshot suggests. Write the intervals before assigning significance.
Then check the close convention. A daily close beyond a monthly band and a still-forming monthly candle within an annual band are different observations. The lower chart may provide useful detail while the higher observation remains unresolved.
Finally, identify the next reset. A monthly continuation thesis formulated on the last trading day of the month may depend on a grid that is about to expire. The larger map may remain relevant, but the local path needs to be recalculated when the new inputs are complete.
Review confluence without selecting only the best examples
The easiest way to make a multi-timeframe method look compelling is to start with a major historical turning point and search backwards for nearby levels. With enough periods, ratios and feeds, some references will often be close. That search is useful for generating questions and weak as a test of a rule already claimed to work.
A stronger review begins with an event definition. For example, the first encounter with an overlap between an annual inner band and a quarterly outer band, under a specified minimum intersection width. The definition should be applicable before the later path is revealed.
Record all eligible encounters, including those where price passes through the area or remains inside it without a clear reaction. Compare them with a declared baseline. Keep the number of trials visible, especially when trying several tolerances or observation periods.
A method can still be useful as a way to organise attention even before a statistical advantage is demonstrated. That practical contribution should be described honestly. Clearer charts and better records are valuable outcomes; they should not be translated automatically into promises of higher returns.
Questions about connecting pivot timeframes
Does the annual grid always matter more?
It provides the larger reference frame in this routine. That is a choice about analytical hierarchy, not a law that annual levels always hold. A lower-period move can continue through an annual band. The hierarchy should clarify what evidence would change the interpretation, rather than make a larger-period view impossible to revise.
Are three aligned levels three confirmations?
Not necessarily. The underlying observation windows overlap, and the same prices can influence several grids. Treat confluence as a defined geographic overlap on the chart. Any claim that it improves outcomes requires a comparison with a declared sample and event rule.
Should I display all four grids on one chart?
Only if the result remains readable. The three-chart layout in the recording keeps each map's role visible. A small matrix plus a few selected overlaps can be clearer than a single chart covered with annual, quarterly, monthly and weekly labels.
Can I keep the chart timeframe fixed?
Yes, if the indicator lets you choose the pivot reference period explicitly. The calculation depends on the defined inputs, not on an obligation to use the exact chart arrangement shown in the video. Verify the settings and data availability rather than relying on a chart's appearance alone.
What if the grids disagree?
Record the disagreement. A monthly recovery into an annual resistance area may be the most informative part of the setup. The task is to identify the relevant encounter and its conditions, not to force all rows of the matrix into the same directional label.
Where does this fit with the other guides?
The calculation guide establishes the arithmetic. The price-location guide explains the three ranges. The 0.702-zone guide examines the outer band. This article connects those ideas across periods while preserving their different inputs and reset dates.
Check the calculation.
Enter completed-period prices to verify the focal levels and band boundaries. These inputs are illustrative and do not request live market data.
Your pivot grid.
| Reference | Lower side | Upper side |
|---|---|---|
| 0.184 line | 86,472.27 | 105,461.07 |
| 0.702 line | 59,743.47 | 132,189.87 |
Using the rounded Bitcoin example.
Andrey
Founder of TradeLean. Engineer with a PhD, senior industry executive and long-time investor and trader. The work brings Lean thinking to chart analysis, historical research and market foresight.
About the author ↗Join the conversation
Discussion
Questions, observations and thoughtful challenges to the research are welcome.
No comments published yet. Start the discussion below.
Leave a comment
Comments are reviewed before publication. Keep the discussion relevant and respectful; please avoid personal financial or account details.
Educational research, not personal investment advice. Historical examples and hypothetical illustrations do not establish future performance. Risk Disclaimer.